Nuremberg Campus of Technology

JavaScript Evaluation und Chart.js

Vanille JavaScript
Typo3
Chart.js

Overview of this project

In this project, I implemented a couple of JavaScript-based Sustainability Check for the Mittelstand-Digital Zentrum Franken, including complete UI development and design adaptation in line with their corporate identity.

  • UX Research
  • UI Design
  • JavaScript, CSS3, Typo3, HTML5
Workflow

Vanilla Javascript and Chart.js

The script generates context-specific recommendations based on the users’ input, enhancing interactivity and providing immediate feedback.

Target Group

Persona

USP

Outline of Scope

The application dynamically loads structured questions from a JSON file, renders an interactive questionnaire, and handles user selections with real-time updates. 
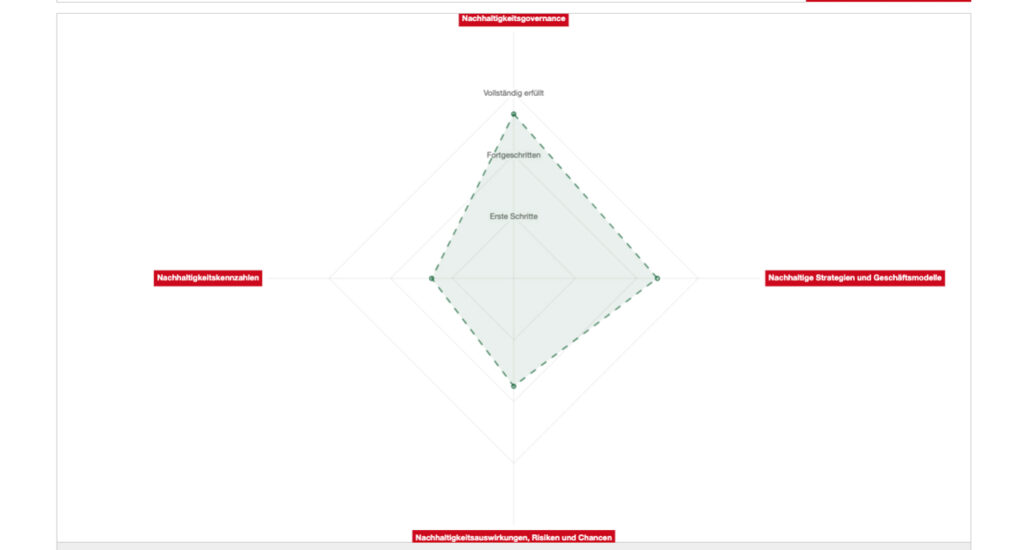
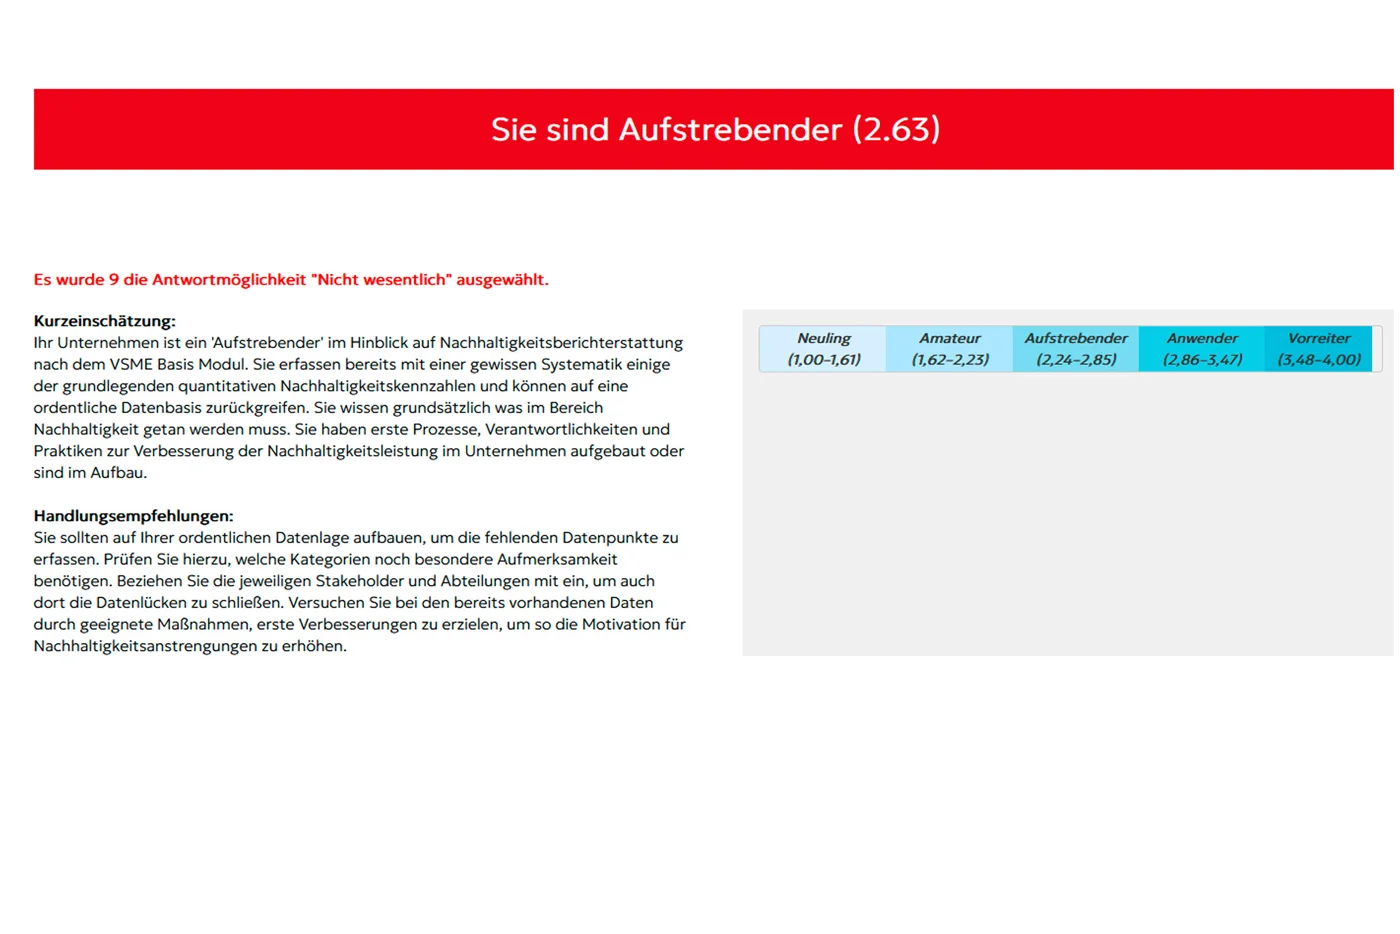
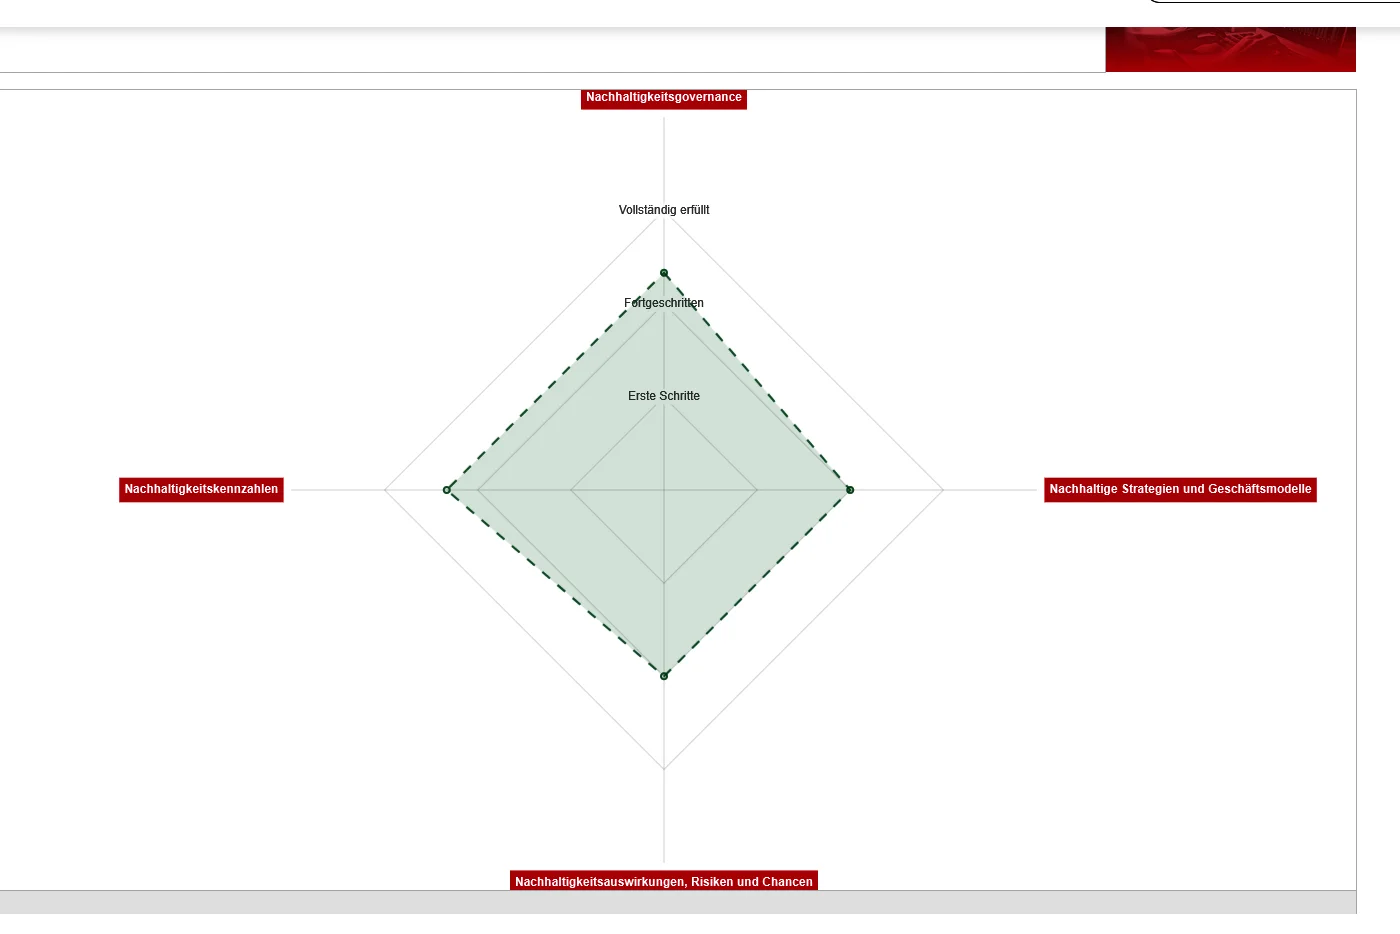
User responses are processed to calculate average scores per category, which are visualized in a dynamic radar chart using Chart.js.

  • Functions:
    • JavaScript Checkbox-Evaluation
    • Datavisualization with chart.js
    • Pdf Output
    • Supabase integration
    • CSS Styling

Let´s talk about
our next project.